Vacant Land Mid-Year 2017
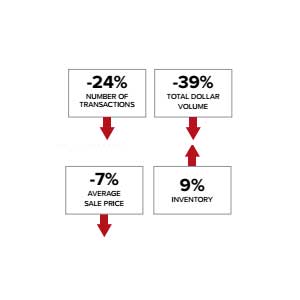
Single-family vacant lot sales spiked in the first six months of 2017 with 49 sales (up 75%). Meanwhile the average and median sale prices dropped, down 25% and 14% respectively, when compared to mid-year 2016. The drop in the average and median sale prices is a result of the spike in the number of vacant land sales under $1 million (up 143%). NOTE: Most areas of the valley experienced an increase in vacant single-family lot sales over last year.
Who is buying vacant land? The 2017 demographics have changed some: While half of the buyers are still second homeowners and retiring baby boomers, the remaining half are buying for spec building. This trend continues to bode well for our local construction industry. NOTE: Most residential vacant land purchases were cash (59%), bought by end-users intending to build a home for themselves or to speculate.
Single-family vacant lots under contract – 11 properties currently in negotiations (down 8%), of which only two are listed for under $500,000 and five for over $1 million.
Available inventory of listed lots dipped 9% from Q2 2016. Following suit the dollar volume and median list price are down 11% and 7% respectively. The drop in the median list price reflects more inventory in the under $500,000 segment of our market. NOTE: Supply will continue to outpace demand so do not expect to see appreciation in this segment for the remainder of 2017. Based on mid-year results, there are currently 18 months of available inventory.
Current available inventory breaks down as follows: 15 single-family lots under $500,000 (up 15%); 49 lots between $500,000 and $1 million (down 10%); 41 lots between $1 and $2 million (down 15%); 20 lots between $2 and $3 million (down 17%); 11 lots between $3 and $5 million (up 22%); 13 lots between $5 and $10 million (down 15%); and five lots over $10 million (down 17%)
This information was derived from the Hole Report, the full report can be found here: https://jacksonholerealestatereport.com/2017-second-quarter-report/vacant-land/
 Transactions 34
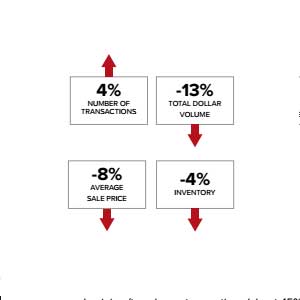 Transactions 189